Published May 27, 2022 | Updated October 18, 2023
By MedCourse
Useful, relevant, and interesting content for UK Junior Doctors.
Quality improvement is a core part of working within NHS and healthcare environments. Every department within a trust will be running several quality improvement projects at any given time to improve its service provision.
For many junior doctors, nurse practitioners, and physician associates, Quality Improvement Projects (QIPs) have been integrated into their training programme curriculum. This can result in QIP becoming a “tick-box exercise” – but taking the helm of a quality improvement project can have its advantages:
- Brownie points from your consultant or line manager
- Something to impress interview panels with, and gain points in some interviews such as the core anaesthetics interview
- Potential for awards, posters, and publications
- Extra points for the IMT application & CST application
- Being able to make a difference in patient care
Even if you’re choosing to take a year out of training, work abroad, or build some side hustles, it’s always worth taking part in QI activity if you plan to progress through a traditional medical career.
So, what is a quality improvement project and how do you take part in one?
What is a Quality Improvement Project?
There’s no universal definition of healthcare quality improvement, but generally, it’s taken to mean a structured approach used to improve the quality of care provided to a patient, including:
- Enhancing the patient experience
- Improving patient safety
- Boosting clinical effectiveness.
There are many types of QI methodology you can use to achieve this, but in this article, we will use the “Model for Improvement” strategy which utilises PDSA cycles to continually improve patient outcomes. In general, a QIP will set a SMART aim to improve service provision, measure baseline data, implement a change, and then repeat data collection to see if the change has made a difference. This is then repeated in cycles until the objective is met.
Quality improvement projects (QIPs) take on many different forms within healthcare – from huge national clinical audits to solo ward-based projects. Both hospital and GP trainees are required to understand and carry out QIPs in both primary and secondary care.
In this article we will be focusing on the smaller projects that junior doctors and clinicians in training can create and implement on their own or in small teams.
Quality Improvement vs Audit
While audits are performed in a similar way to a quality improvement project, the key difference is how you approach the problem and take steps to change it.
Clinical audits use a set of standards (such as NICE guidelines) to collect data on how well their service is doing and which standards are not being met. This can be done at scale on a rolling basis to monitor for problems within healthcare services and is often done at regular intervals with repeat audit cycles.
Healthcare quality improvement projects, on the other hand, don’t necessarily require a set of clinical standards. QIPs set an objective which focuses on a specific measurable change and will result in an improvement in service provision if met. While QIPs can be done on a long-term basis, they are usually to be designed to continue with cycles until the objective has been met.
One way of seeing the difference is that clinical audits focus more on “quality assurance”, whereas QIPs focus on “quality improvement”.
How to Perform a Quality Improvement Project
If you’re new to the NHS, or you’ve only had limited involvement in QI activities thus far, it might seem daunting to oversee the entirety of a project. Rather than tackling it all at once and becoming overwhelmed, take it one step at a time. Here are some of the steps you need to take:
The Model for Improvement – Plan, Do, Study, Act (PDSA) Cycles

PDSA cycles are a core feature of the QIP process. This gives you a structure around which you can plan and carry out the steps of your project:
Plan – Work out what your objective is and how you will measure the data
Do – Carry out data collection
Study – Analyse your data to determine if you have met your objective
Act – Intervene to improve your outcome, and plan for when you’ll next be able to carry out another cycle after your intervention
A “full cycle” of a quality improvement project involves going through a PDSA cycle once to collect baseline data, and then again following the intervention to assess its effect on your primary outcome. “Multiple cycles” will require baseline data, then multiple PDSA cycles with an intervention followed by analysis after each cycle.
Next, we’ll discuss how to carry out your QIP using the PDSA methodology.
Plan – S.M.A.R.T Objective and Methodology
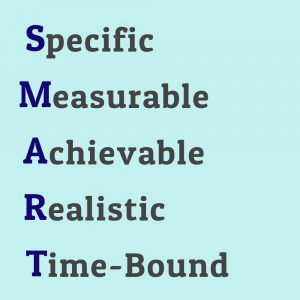
When going through your first PDSA cycle, you’ll need to form a SMART objective and decide how you will collect data.
Using SMART to plan your QIP’s aim gives you the ability to focus on the problem at hand and avoid adding unnecessary steps which add to your workload. Your objective should be:
Specific – Includes a focused statement on exactly what you are trying to achieve.
Measurable – Has a numerical value which can be measured
Achievable – Has an attainable goal which is in your sphere of influence to change
Relevant – is aligned with your department’s aims and improves patient outcomes
Time-bound – Has a specific timeframe by which your aim should be achieved
Example SMART aim
If you work in a cardiology ward, your SMART aim might be:
“To increase the percentage of myocardial infarction patients with heart failure (LVEF <40%) who have been prescribed a mineralocorticoid receptor antagonist (unless contraindicated) to > 90% by November 2022”
The focus of this goal is specific, it has an outcome which can be easily measured, is achievable by using a prescribing protocol, is relevant to ESC guidelines for cardiology, and gives a time by which the aim should be achieved.
Once you have your SMART objective, you’ll need to figure out what data you need to collect to determine whether your interventions are effective. You’ll need to consider:
- How much data will be required to provide evidence of improvement of your SMART objective
- How to fit data collection into your daily working life
- How long each round of data collection will take
- Whether your data will be measured prospectively (looking at concurrent records) or retrospectively (looking at past records)
Do – Measuring Data
Before you make an intervention for your quality improvement project, you need a baseline set of data so that you can show an improvement. You also need enough evidence to show that your baseline data represents an accurate figure.
Try to collect data electronically if possible – on EMRs for hospital trainees and for GP trainees on programmes such as EMIS for general practice. This will allow you to quickly record and analyse the data.
The best way to do this for prospective data collection is by taking data on multiple occasions – three should be enough to show that your results are consistent. Depending on how much data you can collect on a given day (which may be limited by the frequency of the event that you’re trying to improve on), this could be over a day, week, or month.
Example of Data Collection
Using the above SMART aim of improving mineralocorticoid (MRA) prescriptions in ACS+LVEF<40% (acute coronary syndrome + Left Ventricular Ejection Fraction less than 40%), you should have enough ACS patients admitted to your ward to take data on 5-10 patients for one week, then repeat this in the two following weeks. You can collect this data using your handover list at the end of each workday, finding new ACS patients, and checking their notes to see:
- If their LVEF is <40%
- Whether an MRA is contraindicated
- Whether an MRA is prescribed
Collect this data on paper or using an excel spreadsheet, taking care not to record any confidential patient information.
For the following QIP cycle, you can use the same methodology so that you’re able to compare data. While you’re able to make minor changes to how you collect the data, you must be able to compare it to your baseline. I’d suggest using the planning segment of your second cycle to work out what aspects of data collection were inefficient and whether you need to increase or decrease your sample size.
Study – Analyse Your Data
If you’ve kept your scope narrowly focused on your SMART objective, analysing your data should be easy. Using simple yes/no questions will allow you to make a basic calculation which gives you an answer as to whether your objective has been achieved.
Example of Data Analysis
For the example QIP, you will have three answers for every ACS patient:
- Does the patient have an LVEF <40%? Y/N
- Is an MRA contraindicated? Y/N
- Has an MRA been prescribed? Y/N
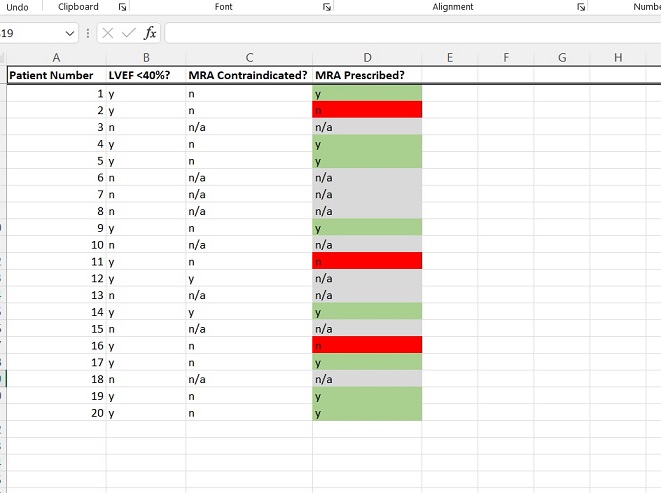
Patients for whom the first or second answers are no can be excluded from the analysis. Once you’ve removed them (those who have n/a in their row in the above example), you will have a list of patients who have ACS, LVEF <40%, and who do not have a contraindication to an MRA.
To answer your smart objective, you just need to work out the percentage of patients on this list who have had an MRA prescribed. If it’s over 90%, you’ve met your objective. If it’s under, it’s time to intervene.
Act – Making an Intervention
This is the part where you can get creative. You have the data, you know what needs to be fixed, but now it’s time to work out how to fix it. You can do this in so many ways:
- A staff teaching session
- A new departmental guideline
- Posters or reminders stuck to notes
- Equipment changes
- Rota changes
- Meetings with upper management or in general practice a practice manager
You can come up with ideas for your intervention by process-mapping the clinical event you’re trying to improve upon. Write down each step that the patient goes through during this process.
Once you’ve got your process map down, write down all the steps where you can make an intervention. Go through the list and cross out anything that isn’t realistic, achievable, or within your control. You can discuss interventions with key players in your department to decide which will make the biggest difference.
Implement one of your ideas and leave enough time before your next round of data collection for it to have had an effect. Then go back to the plan section for cycle 2!
Example of an Intervention
Here’s a process map using our example from above:
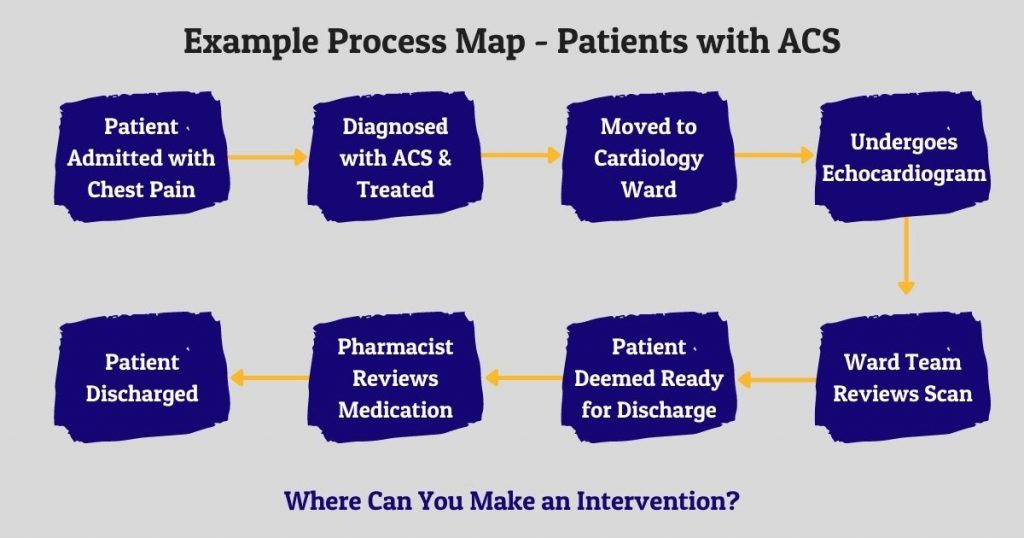
Here are a few interventions which might improve on our example QIP objective:
- A sticker for Echo staff to stick on all patients with LVEF <40%
- A teaching session for ward staff on MRAs
- A new trust guideline for ACS
- A medication checklist to fill out at discharge for all ACS patients
Getting the Most Out of Your QIP
After putting in all the time, effort, and mental energy, you only need to put in a little extra effort to get something useful out of your QIP. Anything that you can squeeze into your medical portfolio is an added bonus.
One of the easiest ways to do this is to present your QIP to your local hospital or department. Instead of writing 10,000 words that are, let’s be honest, unlikely to be read in detail – make a PowerPoint presentation and kill two birds with one stone.
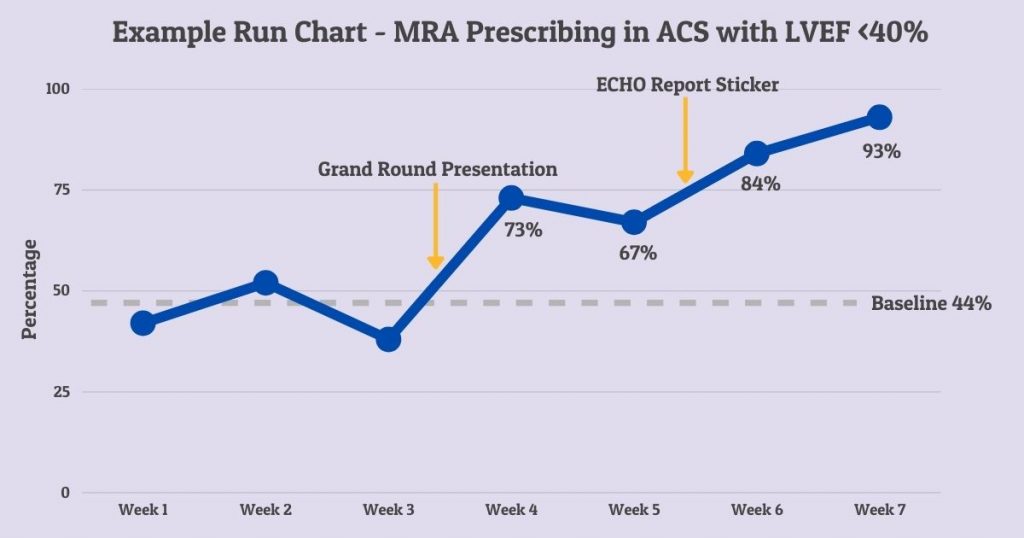
By creating a PowerPoint instead of a write-up, you can cut down on the writing, while still having the opportunity to present the data in a way that engages your audience. You can easily incorporate graphs, run charts (see below), and graphics into your presentation to keep your colleagues from falling asleep. By doing this you’ve bagged a few extra speciality application points and earned some extra kudos at interview.
If you haven’t had a poster published at a national conference, this is also a great opportunity. Quality improvement and trainee conferences are very likely to accept your QIP as a poster if you present the information clearly, and you’ve already made all the graphs and charts to go with it!
Example of a Run Chart
Here’s a run chart using our example from above:
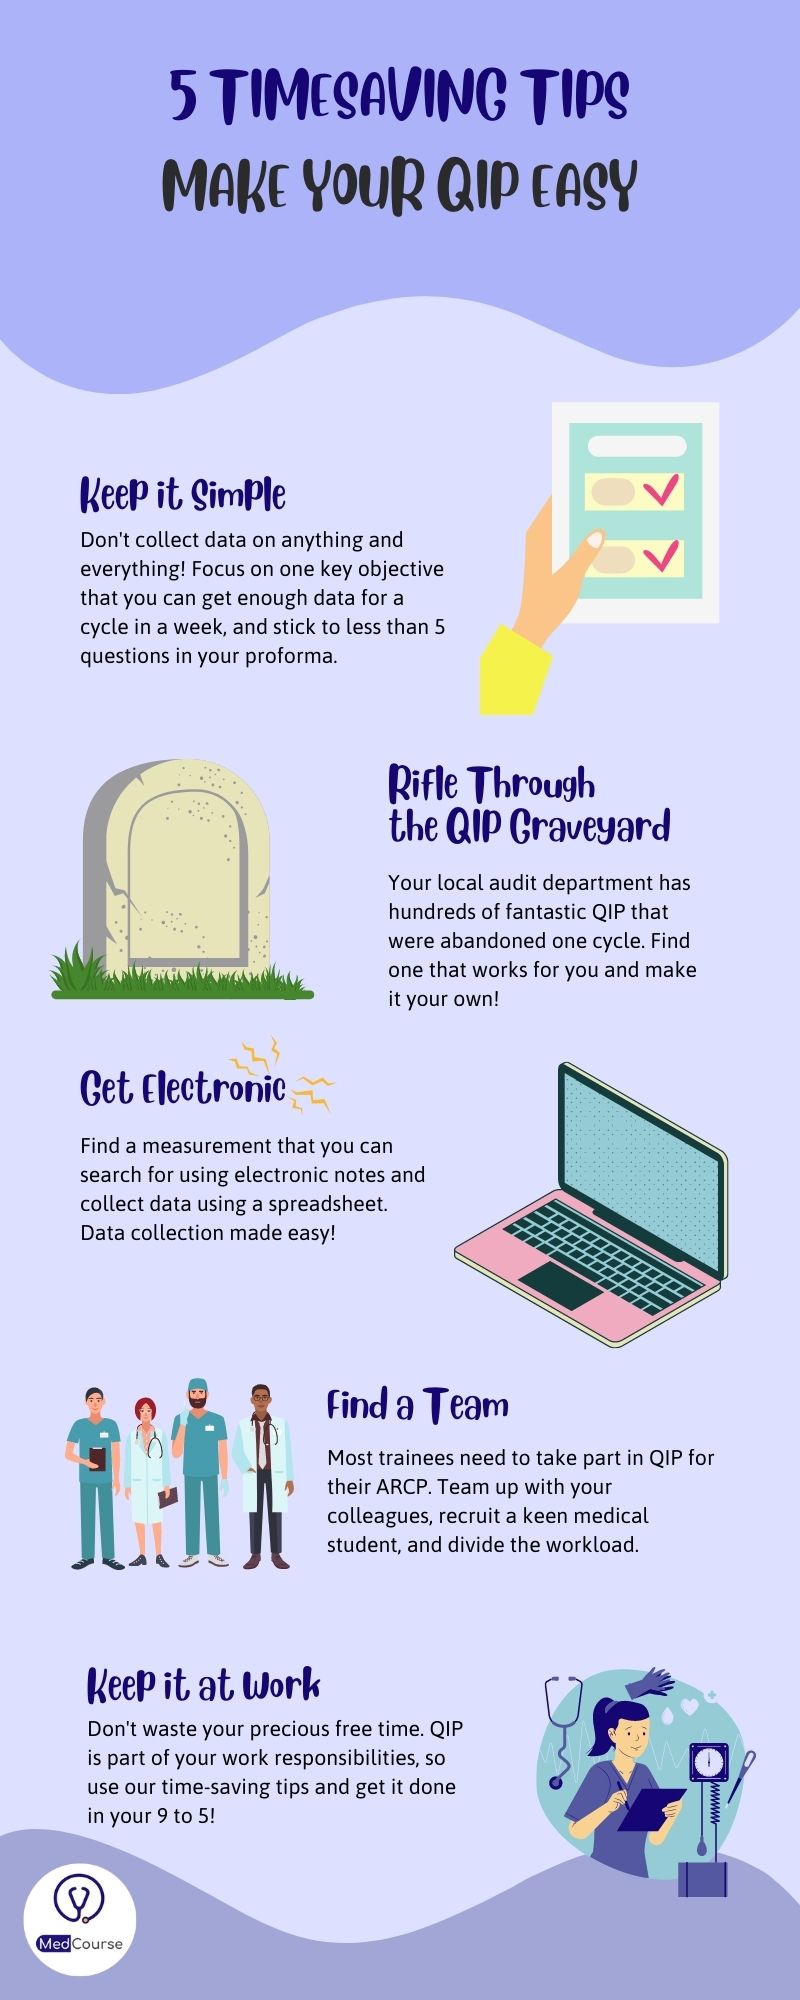
5 Timesaving Tips to Make Your QIP Easy
